Tracking the Industry Rebound with the F-Prime Fintech Index
Tracking the Industry Rebound with the F-Prime Fintech Index
Introducing our upgraded tool for tracking public fintech markets
Last month, we launched our new version of the F-Prime Fintech Index. Users can now explore:
- Adaptive visual multiples and benchmarks
- Head-to-head company comparisons
- Adaptive sector and vertical-specific benchmarks
- Time series of historical metrics by sector and revenue growth
- Company and sector comparisons by revenue, growth, margins, multiples, and more.
Using these new tools, we wanted to share some key insights.
Fintech is Recovering
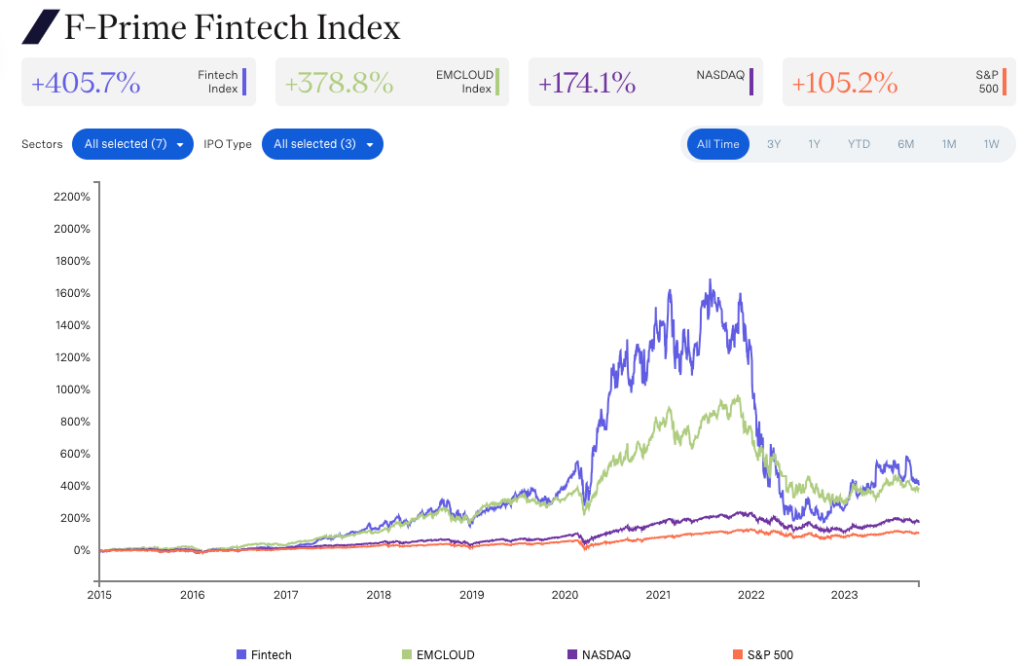
While the F-Prime Fintech Index took the steepest decline of all the indexes we’re tracking in 2021 and 2022 — plummeting 72% in 2022 — it has also experienced the sharpest rebound over the last 12 months, climbing 67%. While this is still far from its peak, fintech businesses continue to grow and we expect to see more IPOs return to the market over the next few years.
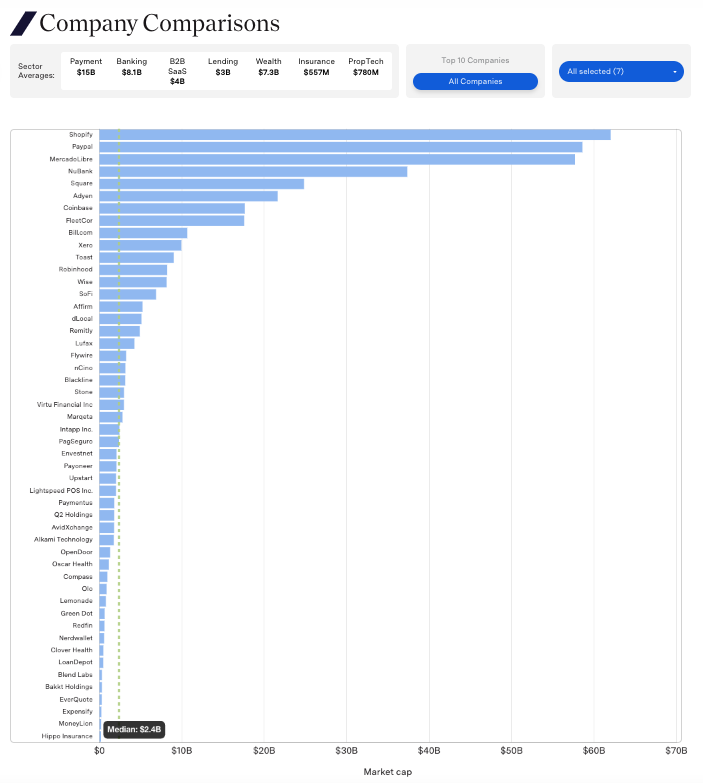
In terms of market capitalization, Shopify, Paypal, MercadoLibre, Nubank, and Square are all leading the F-Prime Fintech Index. These companies are also top contenders for revenue.
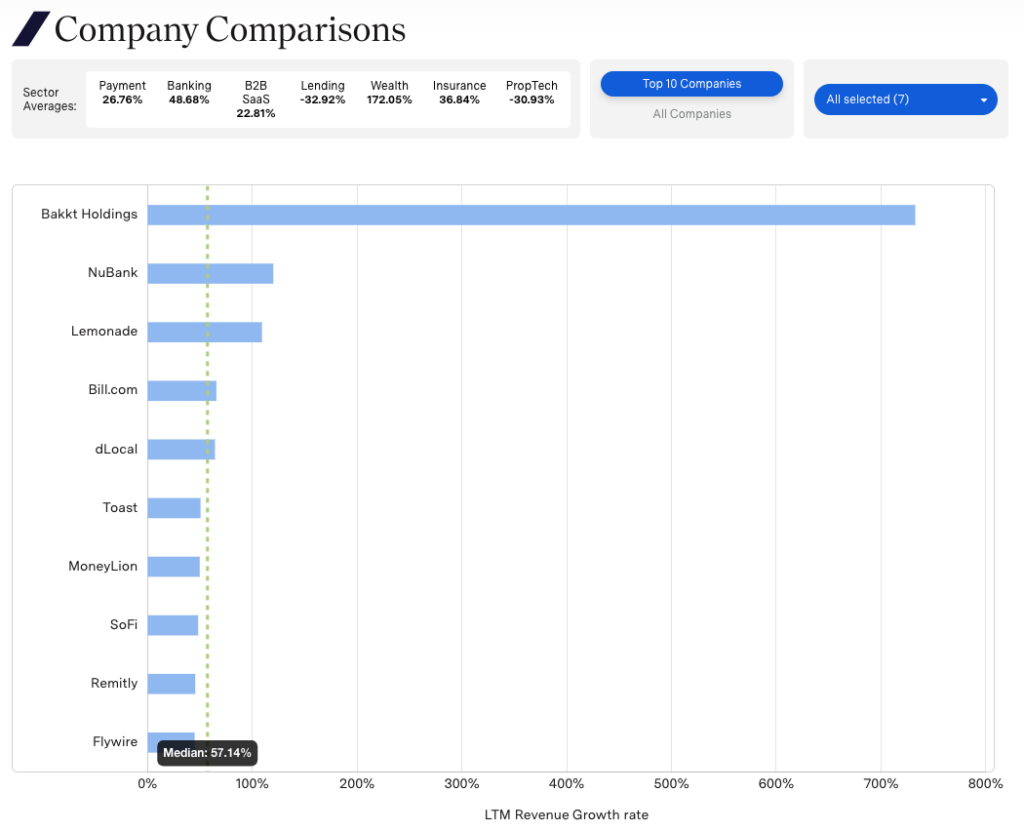
For the top ten companies in the F-Prime Fintech Index, median growth rate remains stable at 57 percent despite the changes in valuation.
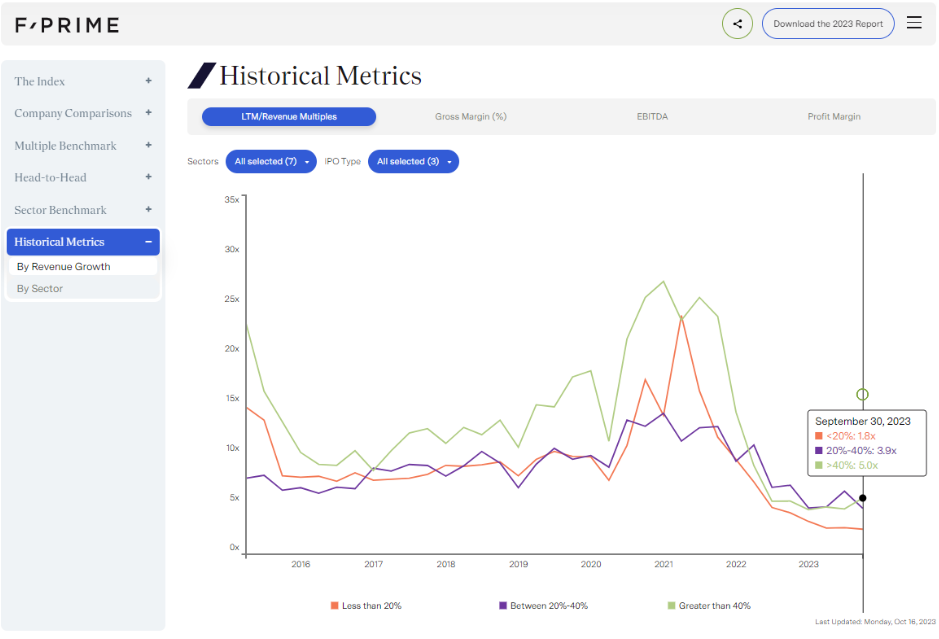
Meanwhile, there has been a large recalculation of revenue multiples. Median growth rate companies (those that grew LTM revenue by 20-40 percent) are now trading at 5x. Throughout 2020 and 2021, they regularly traded at more than 10x.
Payments
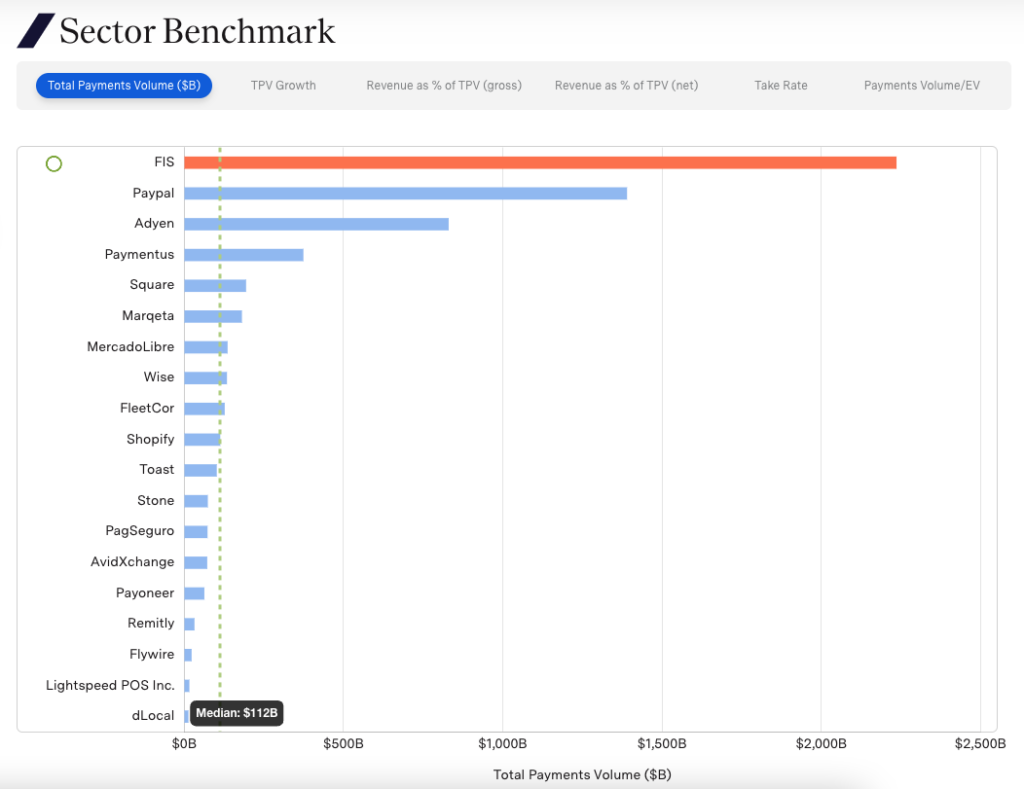
FIS, Paypal and Adyen have the largest payment volume, with $2.2T, $1.4T, and $829B respectively.
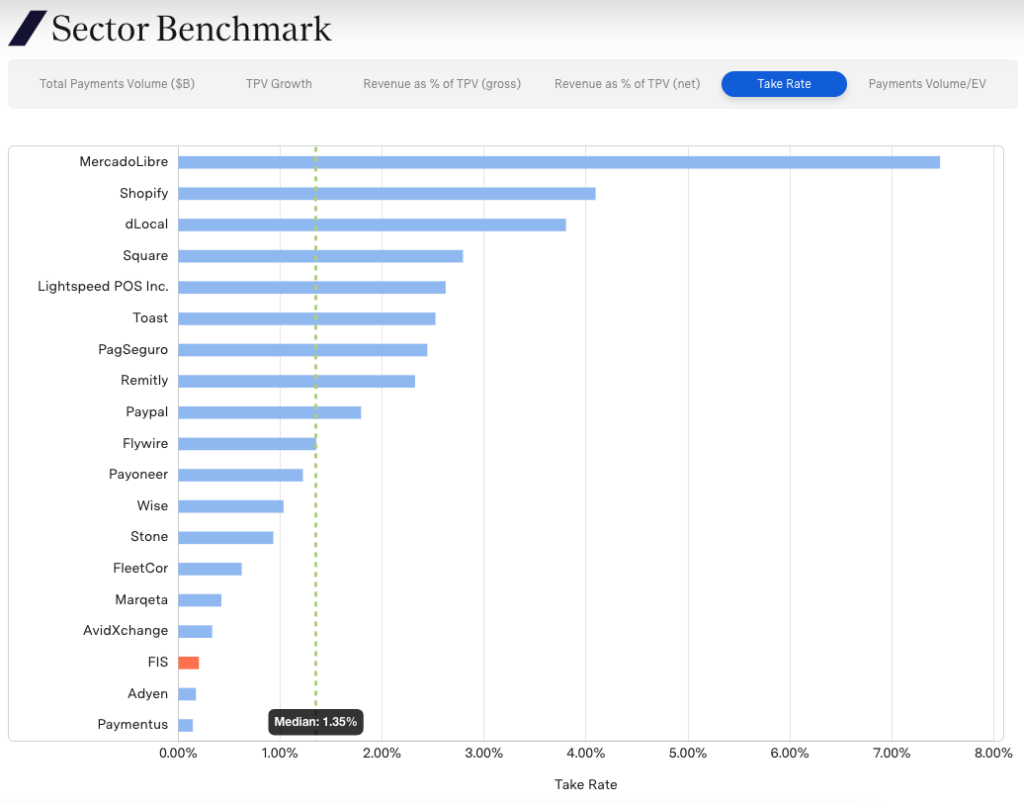
Meanwhile, MercadoLibre, Shopify and dLocal have the highest take rate.
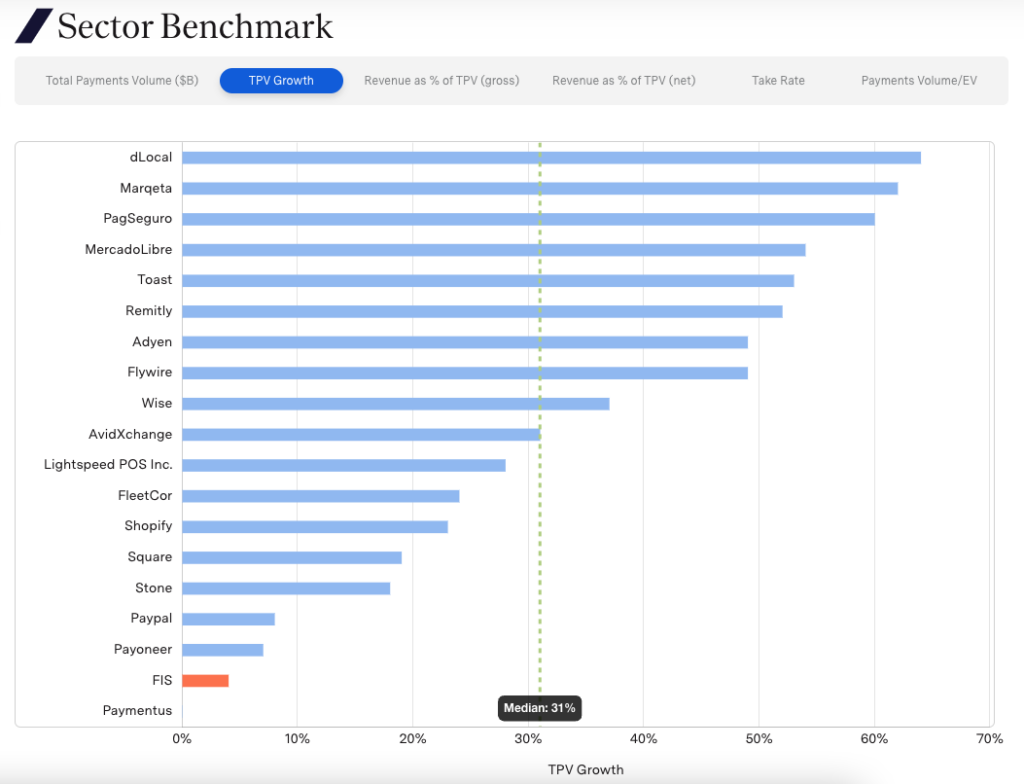
Finally, dLocal, Marqeta and PagSeguro top the TPV growth chart.
Banking and WAM
In terms of users, disruptors like Nubank and Nerdwallet are catching up to large incumbents like Chase. Their growth rates are high — 33 and 7 percent, respectively — with considerably lower CAC.
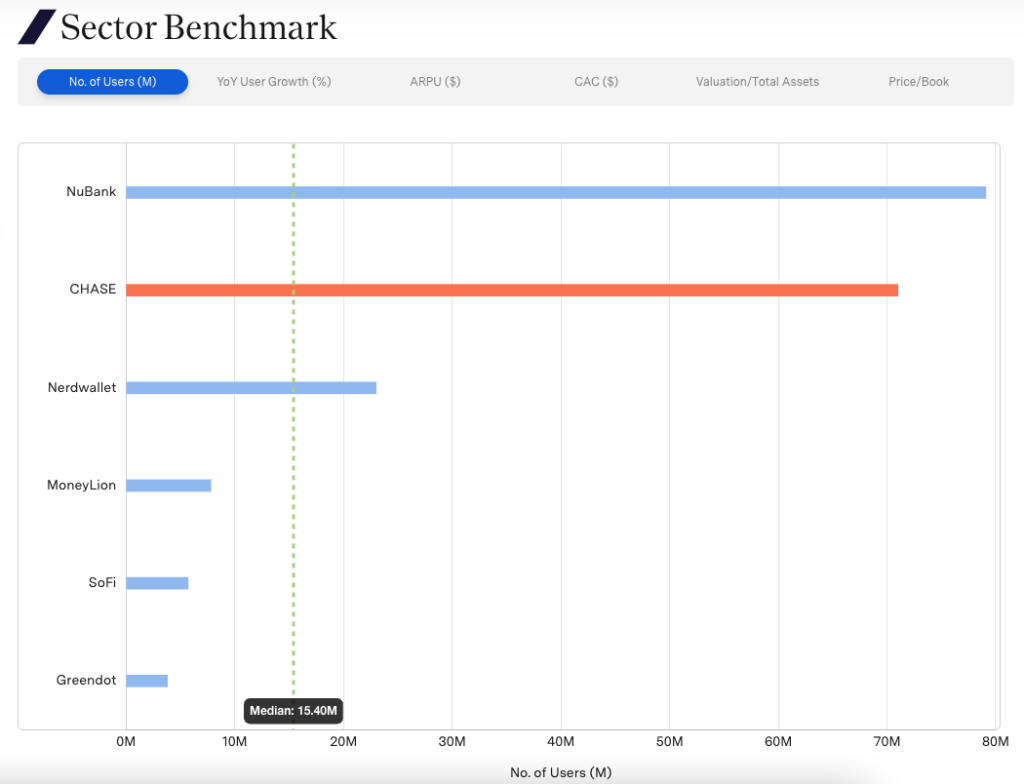
Of course, Chase clearly has a much, much higher market cap — $410B vs $37B for Nubank — as it can extract more value with multiple lines of business, the most profitable of which are Consumer & Community Banking and Asset & Wealth management. It remains to be seen if the challengers can monetize users as successfully as incumbents.
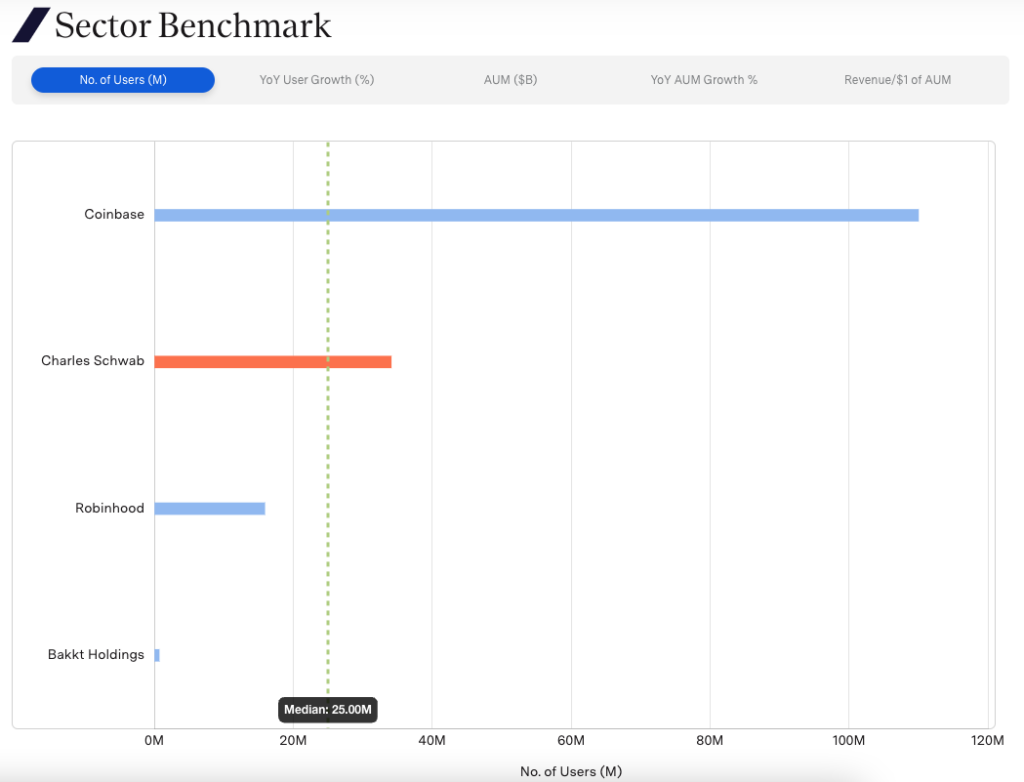
Despite an ongoing “crypto winter” that has reduced the number of users and overall holdings for companies like Coinbase, crypto companies are still managing large numbers of both. Meanwhile, equity trading disruptors like Robinhood are also quickly catching up to traditional incumbents like Charles Schwab in terms of number of users, with 15.9M vs 34.1M and a 34 percent growth rate. At the current rate, Robinhood could eclipse Charles Schwab’s user numbers by 2026.
However, much like in the banking sector, incumbents like Schwab retain considerably higher AUM and can monetize users more effectively. It remains to be seen whether challengers like Robinhood can challenge incumbents in terms of monetization.
Explore the Index
The F-Prime Fintech Index is a free resource, and a great place to see what’s really going on in the industry. Questions? Insights? Get in touch here.


